L.A. vs. the Wonks: District’s 8th-Grade Reading Miracle on NAEP Draws Scrutiny
High-performing charters amount to ‘one piece of the puzzle’ explaining the district’s 9-point jump, testing officials say, but not all of it

Get stories like these delivered straight to your inbox. Sign up for The 74 Newsletter
When the nation’s most important test dropped in late October, the news was abysmal: Scores were among the worst in its history.
But amid the carnage, one feel-good story emerged. Los Angeles, the nation’s second-largest school district, appeared to have accomplished a reading miracle, with eighth-grade scores jumping an incredible nine points.
Peggy Carr, the nation’s top testing official, called the district’s performance one of the few “bright spots” on the National Assessment of Educational Progress, otherwise known as “The Nation’s Report Card.”
The media took note. Time and The Wall Street Journal trumpeted the development, one that Alberto Carvalho, the district’s superintendent, said “bodes very well for our L.A., and is really a testament to our strategy.”
Almost as soon as the news sank in, however, a host of naysayers emerged to pop L.A.’s balloon. Among wonks on edu-Twitter, the skeptic’s case went something like this:
- Nine-point jumps on NAEP are extremely rare.
- It happened in a huge urban district and during an educationally punishing pandemic, when most school systems’ scores tanked or, at best, stayed flat.
- NAEP is typically harder than most state assessments. Yet L.A. scores on the national test eclipsed those on California’s Smarter Balanced assessment, where the district’s eighth-grade readers inched forward a barely perceptible half a percent.
Speaking for many researchers, Robin Lake, director of the Center on Reinventing Public Education, took to Twitter to say the results don’t “sit right.”
At first, they didn’t sit right with the test’s administrators either. That’s why prior to NAEP’s release, the National Center for Education Statistics conducted extensive internal reviews and called on outside experts to crunch the numbers to understand what they were seeing.
“The L.A. results … certainly caught our attention, because they stood out as different from the nation as a whole and the other” school systems that take NAEP, said Daniel McGrath, branch chief of the assessment division at NCES. Twenty-six districts participated in the Trial Urban District Assessment, which allows for comparisons across the nation’s large urban districts.
The researchers “turned over many additional rocks” to back up a result they knew would raise eyebrows, he said. The American Institutes for Research conducted a separate analysis of the 2022 scores.
The results offer the kind of frustrating nuance researchers are known for, confirming neither the unmitigated triumph of the district’s cheerleaders nor the worst-case scenarios of the skeptics.
After performing a series of statistical checks and balances, McGrath said L.A.’s schools saw a “genuine increase in student performance.” Because of all the interest, NCES plans to add some technical notes to its website explaining factors that affected this year’s results in Los Angeles.
A ‘piece of the puzzle’
L.A. district staff participated in NCES’s Oct. 11-13 pre-release workshop to discuss the results. And on Oct. 19, the NCES team held a separate meeting on Zoom with Carvalho to answer questions about the extra steps it took to verify the data.
The researchers explained that one factor in the district’s performance was the sample of schools in which students were tested. In 2019, the last time the nation’s students took NAEP, L.A.’s high-performing, affiliated charter schools weren’t included. This year, they were.

Including those scores — from five of the 60 schools in the sample — accounted for roughly two points in the nine-point climb in eighth-grade reading, McGrath said. That’s “one piece of the puzzle.”
Affiliated charters are district schools, but operate with some flexibility. They perform significantly higher than district schools overall, and this year’s state test scores show just how much. Forty-two percent of the district’s eighth graders met or exceeded state standards in English, compared to 66% in the district’s affiliated charter schools, according to The 74’s review of this year’s Smarter Balanced results.
Since the scores’ release, Carvalho credited the district’s efforts to provide summer school, tutoring and internet connections during remote learning. “How about those NAEP scores!” he said during public comments Friday. In addition to the nine-point increase in reading for eighth graders, he touted the district’s fourth-grade reading scores, which went up two points compared to an average three-point decline in other districts. And he offered a pointed rebuke to those he described as “interesting fellows” on social media who “work at places like Harvard.”

“They do nothing but study what we do and write about it,” he said. “That data is accurate, and to assert anything other than that is to diminish the impact that our teachers, our principals, our support staff and … our students produced.”
Carvalho doesn’t need to be reminded of NAEP’s reputation as the “gold standard” in testing. He’s a member of the National Assessment Governing Board, which sets policy for the test.
While a nine-point increase is rare, leaps in that range are not unheard-of, according to examples provided by NCES. Boston Public Schools, for instance, saw a 10-point increase in fourth-grade math between 2003 to 2005. And eighth-grade reading scores in the District of Columbia schools jumped eight points between 2011 and 2013.
Demographic shifts
Some experts noted that Los Angeles has also experienced major demographic shifts in recent years that would affect student performance. Immigration has declined in Los Angeles County, and Carvalho has often noted that officials can’t account for thousands of missing students.
Between the 2019-20 and 2021-22 school years, district enrollment fell by a staggering 10%. This factor deserves more attention, said Thomas Dee, a Stanford University economist and education professor.
“The composition of that enrollment changed by a variety of student traits and the impact of such changes on LAUSD’s recent test scores is far from clear,” said Dee, who has been tracking pandemic enrollment trends.
NCES officials thought of this, too.
It turns out that demographic changes didn’t affect the overall increases. In fact, students in each racial and ethnic group made gains between 2019 and 2022. The district’s Hispanic student enrollment fell during that time period while enrollment of white students increased. But the addition of the affiliated charters effectively canceled out the impact of that population shift, McGrath said.
NCES also considered one group of students who didn’t participate in this year’s NAEP — those who were still learning remotely in spring 2022. Last year, the district’s virtual school, City of Angels, included 76 eighth graders. If they were all lower-performing students and if they had been included in the sample, it’s possible the district’s scores would have been lower. But to drag it down even one point, those students would have had to score 20 points below the district’s average, McGrath said.
The NAEP results also didn’t jibe with typical comparisons to state tests. Usually, districts perform better on state assessments than on NAEP.
In this case, the overall percentage of Los Angeles students meeting or exceeding standards on the Smarter Balanced test declined since 2019. In eighth-grade English language arts, however, there was a miniscule increase — from 41.14% to 41.74%.
The discrepancy could be chalked up to the fact that the state test includes a writing section and NAEP does not, said Andrew Ho, an assessment expert at Harvard and part of the research team behind a new Education Recovery Scorecard that uses NAEP and state test data to calculate learning loss.
In an explanation of why these discrepancies occur, the team notes that it’s also possible for the students who took NAEP to include more high performers than the larger state sample.
‘Still a full two years behind’
The district’s results confused some education advocates in Los Angeles as well. They expressed doubt that the strategies Carvalho points to were robust enough to spark such an increase.
“None of it was happening at the scale any of us were hoping it would,” said Hannah Gravette, regional vice president for Los Angeles with Innovate Public Schools, an advocacy organization that works with families in low-income communities.
The district is offering virtual tutoring and homework help, for example, but she said the type of in-person, consistent tutoring known to benefit students is still in the early stages.
But the superintendent who was in charge when the pandemic hit said he is not surprised by L.A.’s testing windfall.
“You can’t point to one thing. We did everything possible, and I don’t know of any other school district in the country that did,” said Austin Beutner, listing factors such as the district’s extensive COVID testing program, the 140 million meals it provided to families and delivery of devices to students.
“We sent trucks around the country to Apple stores to take inventory out of the back because they were closing,” he said. And hiring aides and reading specialists to run breakout rooms over Zoom allowed students to get more individualized attention than some would have received even in a traditional classroom, he added.
Ray Hart, executive director of the Council of Great City Schools — the network of 78 urban school systems that helped launch the district assessment program — said looking further back than 2019 helps put the district’s performance in context.
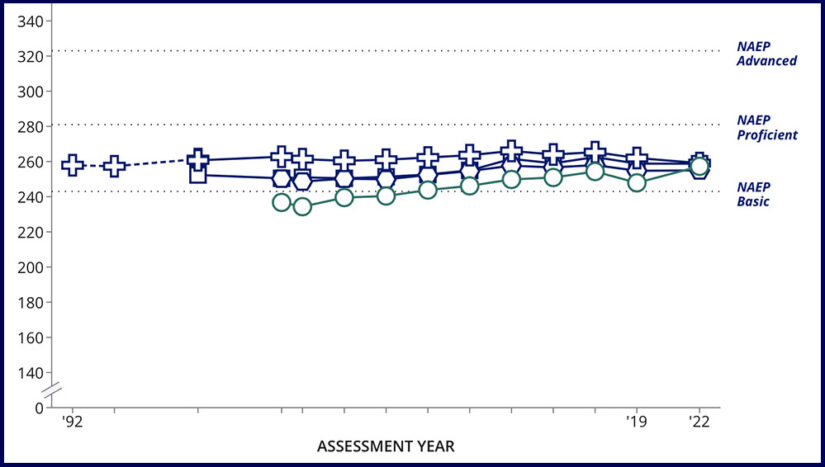
The affiliated charters were part of that 2017 NAEP sample, but not in 2019, when the NAEP score in eighth-grade reading dropped from 254 to 248. McGrath said that just like charters didn’t account for the full increase in 2022, their absence wasn’t the only reason for the decline in 2019. Eighth-grade reading scores fell nationally that year, not just in Los Angeles.
Comparing apples to apples — 2017 to 2022 — the difference in eighth grade reading is much smaller, a three-point increase from 254 to 257 on NAEP. This relatively flat performance is more in line with that of many districts this year, which both Hart and McGrath view as positive, considering the pandemic’s crushing impact nationally.
“The interventions during the pandemic and after are starting to show signs that they are paying off,” Hart said.
Regardless of the reason for the district’s bump, some advocates remain unimpressed.
“It is really not an improvement, but a return to pre-pandemic performance, which means students are still a full two years behind,” said Alicia Montgomery, CEO of the Center for Powerful Public Schools, a nonprofit supporting school improvement efforts in the district.
“Three points is nothing over a five-year period,” she said. “If there was no pandemic, students would have gained far more.”
Get stories like these delivered straight to your inbox. Sign up for The 74 Newsletter


